Back to Home
By Robert W. Meister WA1MIK
edited and HTML'd by Mike Morris WA6ILQ

|
Up one level Back to Home |
A Poor Ham's Deviation Meter By Robert W. Meister WA1MIK edited and HTML'd by Mike Morris WA6ILQ |
|
It's quite a luxury to have all the right test equipment, but it's rather ungainly to drag it all around when needed. Service monitors are a very nice compromise on functionality, accuracy, and range, but they aren't cheap either.
All FM radios have a discriminator or other detector circuit that demodulates the audio contained in the RF signal. The recovered audio may or may not be buffered. If we can connect an indicating instrument (AC voltmeter or oscilloscope) to this audio signal, and can calibrate it to meaningful values, we can measure frequency response and deviation sensitivity (Volts per Hertz of shift).
FM Systems Background:
Recall that FM systems pass information by shifting the Frequency of the carrier signal. When this is done at an audio rate, we say it Modulates the carrier, hence FM. On some equipment, you can control the frequency by applying a DC voltage to the modulator, and in fact, many transmitters use a varying voltage to change capacitance in the oscillator circuit and cause the frequency to shift.
Audio is normally pre-emphasized by FM transmitters. This raises the amplitude of the high frequency audio signals at 6dB (double) per octave, usually having a noticeable effect at frequencies above 400 Hz. The receiver has a matching de-emphasis circuit that decreases the amplitude of the high frequency audio signals, and noise, resulting in a quieter output signal that should resemble the input signal. There are articles and discussions of the various reasons for pre- and de-emphasis elsewhere on this web site.
Currently there are two common bandwidths used by repeater systems: 5 kHz and 2.5 kHz. These often go by the FCC designations 16K0F3E and 11K0F3E. This is the peak, not peak-to-peak, bandwidth of the radios.
MaxTrac To The Rescue:
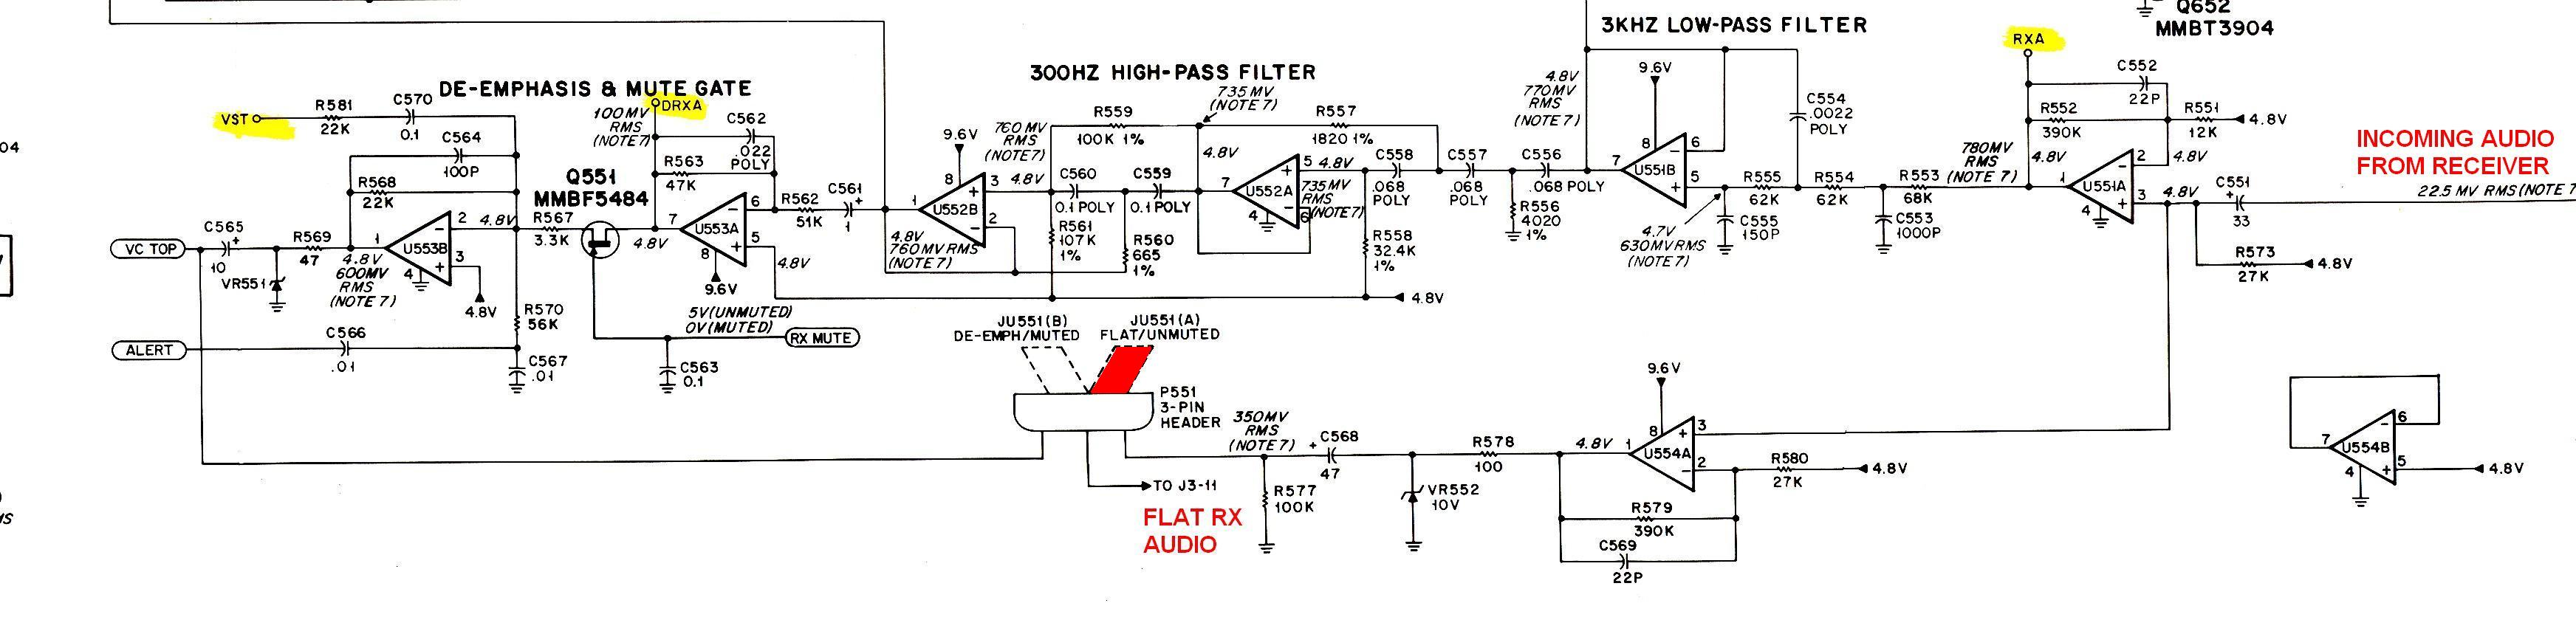
So, what can we use as a good FM receiver? Once again, I turn to the venerable MaxTrac (or Radius) to serve yet another purpose. On models with a 16-pin accessory jack, there's a signal on pin 11 called FLAT RX AUDIO. This buffered signal comes right off the audio demodulator before the de-emphasis components. The MaxTrac schematic indicates there should be 350mVac on that pin with 3kHz input deviation. There's a jumper on the logic board, near the heat sink, called JU551; this must be in the 'A' position (flat/un-muted) for this procedure to work. The 'B' position sends filtered muted audio to pin 11, this is what you get from the headset audio pin of the MIC jack.
The metal arm in the photo goes to the heat sink for the audio output transistors.
Click on the above photos to view them full size.
GTX mobile radios also have flat RX audio on pin 11 and it can be used in the same manner. I performed this procedure on both models for this article. GM300s use a receiver design very similar to the Maxtrac and would also work identically.
If your receiver does not provide a flat audio output, you might still be able to trace the schematic backwards from the volume control and find a spot right at the demodulator. If de-emphasis is present, it will affect the deviation results significantly. You could still follow the procedures here and come up with a correction graph that shows the decreased output level as the frequency increases, but then your deviation measurements would only be meaningful with single-tone signals of known frequency.
MaxTracs (and the similar Radius models) with 5-pin accessory jacks do not provide a FLAT RX AUDIO signal out the back of the radio, but you can solder a wire to pin 3 of the inter-board connector and pick up "detector audio" instead. As long as the indicating meter you attach here is reasonably high impedance and AC-coupled (there's about 4.5Vdc here all the time), it should work just fine. Use a 100uF 16V capacitor in series with your wire if you want to get rid of the DC.
Equipment Required:
You'll need an FM signal generator with a calibrated, variable, deviation oscillator. I used an Agilent E4430B digital signal generator, but many station monitors will also work. If your signal generator doesn't have a built-in oscillator, you could use an external audio source, as long as you have a way of calibrating the amount of signal per kHz that is generated.
I also used a Fluke 189 true-RMS digital multi-meter as the indicating instrument, but an accurate oscilloscope can be used if you want to deal with peak-to-peak voltage measurements. This kind of indicator might be better for viewing the instantaneous deviation of a repeater, rather than one that has a constant modulating tone being fed into it. There are situations where the scope is better than the DMM, and vice versa.
If you don't have a source of a calibrated FM signal, all hopes aren't lost yet. On some radios, the discriminator output is DC-coupled and the DC voltage will vary as the input carrier frequency is varied. If your radio does this, you can simply monitor the carrier frequency and the DC voltage, then change the carrier frequency and note the DC voltage change. This will give you some number of volts per kHz. The amount you change the carrier frequency is the same as if an audio signal modulated the transmitter and caused an identical frequency shift. Audio usually shifts the carrier back and forth; varying the signal generator one way or the other has exactly the same effect.
Note from WA6ILQ:
Years ago a DC coupled scope on the discriminator metering point was the standard way to
measure deviation - you put the scope probe on the discriminator test point, key a synthesized
radio and adjust the scope for a zero volt DC reading, then go up and down 5 kHz and put marks
on the scope screen with a piece of masking tape. Then key up the radio under test and loudly
yell a long, drawn out "four" (i.e. "fouuuuuuuuuur") into the microphone (the yell was an
attempt to drive it into clipping). Non-symmetrical deviation or clipped modulation is
instantly visible, and you can easily see if you had +/-5 kHz peak deviation. If the scope had
11 horizontal graticule lines (zero, +5 and -5) you can easily adjust the vertical positioning
to dead center, then tweak the DC vertical gain to line up the +5 kHz with the top line and
-5 kHz to the bottom line, and then do direct readout of peak deviation.
Collecting The Data:
I connected my signal generator to the radio with a short piece of coaxial cable. I set the RF output level to -50dBm (about 1 millivolt) to make sure the receiver gets a nice quiet signal. I used the internal sine wave FM modulation capabilities of my signal generator.
I connected a true-RMS AC voltmeter to the FLAT RX AUDIO output signal and set it to display the results in dBm. On this scale, zero dBm is equal to one milliwatt, which is 0.775 volts across 600 ohms. A change of 20 dB is equal to a voltage change of 10, so 20dBm is 7.75 volts and -20dBm is 0.0775 volts. A 6 dB change is double or half the voltage. I use dBm more for convenience, but since pre- and de-emphasis specifications are usually some number of dB per octave, I'll stick with them for now.
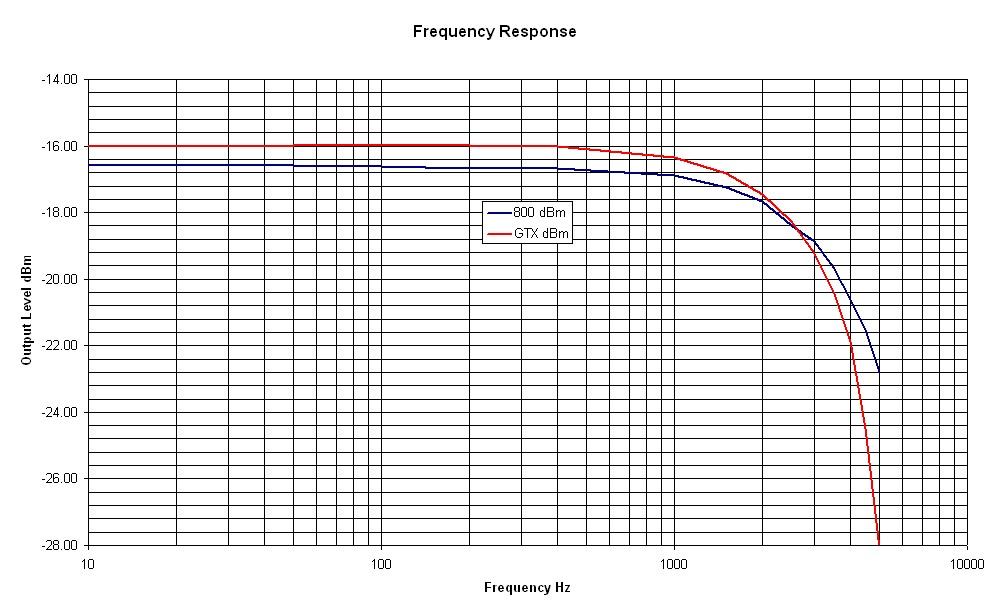
The first step is to see how flat the audio recovery circuitry is, across the frequency range of 10 Hz to 5000 Hz. Some high-frequency roll-off is to be expected above 3000 Hz. Set the modulation frequency to 400 Hz and set the deviation to a convenient level of about 20-40% of the allowable bandwidth of the receiver. If you use high levels of deviation, your results may be inaccurate. I used 1 kHz for my 800 MHz MaxTrac and 800 Hz for my 900 MHz GTX. I recorded the output level on the voltmeter at a bunch of frequencies and graphed the results.
| Frequency Response in dBm | ||
|---|---|---|
| Input Signal in Hz |
800 MHz MaxTrac 1kHz Dev |
900 MHz GTX 800Hz Dev |
| 10 | -16.59 | -16.00 |
| 50 | -16.59 | -15.99 |
| 100 | -16.60 | -15.96 |
| 200 | -16.66 | -15.97 |
| 400 | -16.66 | -16.00 |
| 1000 | -16.88 | -16.35 |
| 1500 | -17.23 | -16.83 |
| 2000 | -17.68 | -17.45 |
| 2500 | -18.38 | -18.28 |
| 3000 | -18.88 | -19.24 |
| 3500 | -19.66 | -20.36 |
| 4000 | -20.60 | -21.88 |
| 4500 | -21.50 | -24.49 |
| 5000 | -22.80 | -28.10 |
You can see how flat the results are, up to about 2000 Hz. I could not find any specs on the flat audio response in any of my radio manuals, but I would certainly accept +/- 2dB as being acceptable across the desired range: 10 Hz to 3000 Hz.
Click on the above to view it full size.
We only need this data to make sure the FLAT RX AUDIO signal is reasonably flat over the required frequency range of 10 Hz to 3000 Hz, so it won't affect our data when we measure sensitivity in the next step. If there's a bump in the response here, it will have an effect when you use the radio to measure deviation. You could come up with a calibration curve if the measurements you make at specific frequencies are critical.
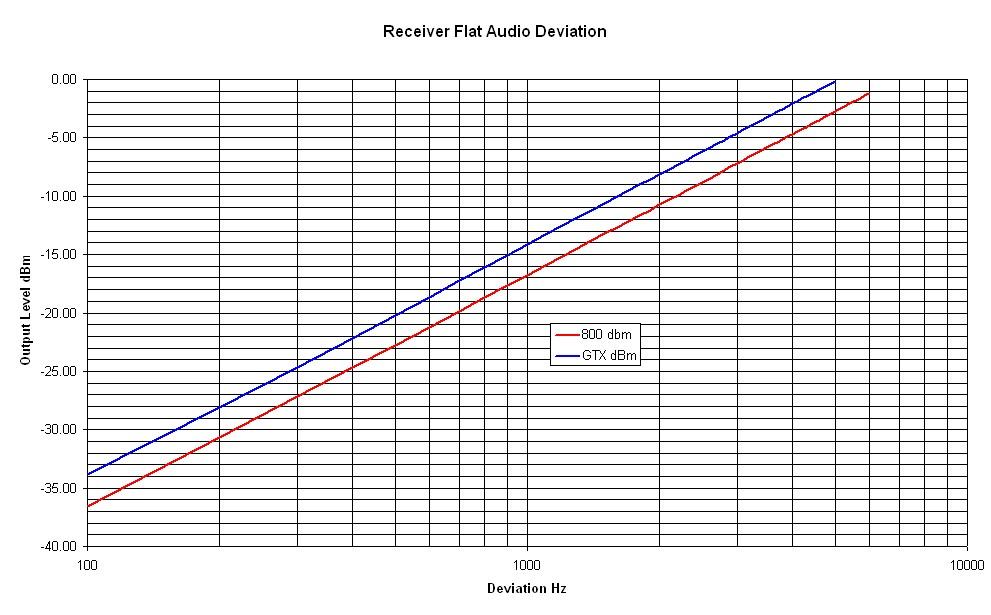
The second step is to set the signal generator's internal modulation frequency to 400 Hz and vary the deviation from 0 Hz to at least the bandwidth of the receiver. (My signal generator wouldn't go below 100 Hz.) Again, record the values and plot the results.
| Audio Response in dBm at 400 Hz Input Frequency |
||
|---|---|---|
| Input Dev. Hz |
800 MHz MaxTrac |
900 MHz GTX |
| 100 | -36.60 | -33.80 |
| 200 | -30.68 | -28.10 |
| 300 | -27.18 | -24.70 |
| 400 | -24.70 | -22.20 |
| 500 | -22.76 | -20.25 |
| 600 | -21.20 | -18.63 |
| 700 | -19.86 | -17.24 |
| 800 | -18.71 | -16.06 |
| 900 | -17.68 | -15.05 |
| 1000 | -16.78 | -14.13 |
| 1100 | -15.93 | -13.29 |
| 1200 | -15.17 | -12.53 |
| 1300 | -14.47 | -11.82 |
| 1400 | -13.83 | -11.19 |
| 1500 | -13.22 | -10.59 |
| 1600 | -12.68 | -10.03 |
| 1700 | -12.15 | -9.50 |
| 1800 | -11.65 | -9.01 |
| 1900 | -11.19 | -8.55 |
| 2000 | -10.74 | -8.11 |
| 2100 | -10.31 | -7.69 |
| 2200 | -9.90 | -7.28 |
| 2300 | -9.52 | -6.90 |
| 2400 | -9.15 | -6.53 |
| 2500 | -8.79 | -6.17 |
| 2600 | -8.44 | -5.83 |
| 2700 | -8.11 | -5.50 |
| 2800 | -7.80 | -5.20 |
| 2900 | -7.49 | -4.89 |
| 3000 | -7.20 | -4.60 |
| 3100 | -6.90 | -4.31 |
| 3200 | -6.63 | -4.04 |
| 3300 | -6.36 | -3.77 |
| 3400 | -6.10 | -3.51 |
| 3500 | -5.84 | -3.26 |
| 3600 | -5.59 | -3.01 |
| 3700 | -5.36 | -2.77 |
| 3800 | -5.12 | -2.53 |
| 3900 | -4.90 | -2.31 |
| 4000 | -4.68 | -2.09 |
| 4100 | -4.46 | -1.88 |
| 4200 | -4.26 | -1.67 |
| 4300 | -4.07 | -1.47 |
| 4400 | -3.85 | -1.27 |
| 4500 | -3.66 | -1.08 |
| 4600 | -3.48 | -0.89 |
| 4700 | -3.29 | -0.71 |
| 4800 | -3.10 | -0.52 |
| 4900 | -2.91 | -0.35 |
| 5000 | -2.74 | -0.17 |
| 5100 | -2.57 | |
| 5200 | -2.40 | |
| 5300 | -2.23 | |
| 5400 | -2.07 | |
| 5500 | -1.92 | |
| 5600 | -1.77 | |
| 5700 | -1.61 | |
| 5800 | -1.47 | |
| 5900 | -1.32 | |
| 6000 | -1.18 | |
As you can see, the data from these two radios differ by about 2.6dB but the lines are quite straight and parallel. A deviation level of 5000 Hz definitely exceeds the modulation capabilities of the GTX radio's receiver, but it was nice to see that it didn't start clipping.
Click on the above to view it full size.
You could take more points, but as you can see, the line is perfectly straight, so extrapolating a value between two frequencies is quite valid and easy to do.
The Dreaded Math Lesson:
If you recorded your data in dBm, you can add two more columns to convert the dBm values to Vac and Vp-p. Zero dBm, as stated earlier, is equal to one milliwatt across 600 ohms. This works out to be 0.775Vac. Recall that:
Power = ( Voltage * Voltage ) / Resistance
Substituting 0.775 for voltage and 600 for resistance, we get 0.001 watts or 1 milliwatt. A deciBel (dB) is normally 20 times the logarithm of the ratio of two voltages:
dB = 20 * log ( V1 / V2 )
In the case where we have a known reference level, it can be slightly modified to suit our needs. If we substitute our reference voltage (0.775 Vac) for V2, we get an equation to convert Vac to dBm:
dBm = 20 * log ( Vac / 0.775 )
Remember this equation - we'll use it a lot later on. If you have peak-to-peak voltage, you can convert that to Vac as follows:
Vac = ( Vp-p / 2 ) * 0.707
Since I did all my measurements in dBm, we can convert it to Vac with:
Vac = 0.775 * 10 ^ ( dBm / 20 )
In English, that's 10 raised to the power of (dBm / 20), or in Excel, this formula:
= 0.775*POWER(10,dBm/20)
Multiply Vac by 2.82843 to get Vp-p. Once you have all of this data tabulated, you can plot graphs for them as well.
Real-life Examples:
Now that we have these pretty graphs, what do we do with them?
Connect your meter or scope to the FLAT RX AUDIO point on the radio and select the frequency of your nearby repeater. If there's a QSO already in progress, look at the peak-to-peak deviation with a scope, or try to make a guess from readings on the meter. Typical deviation levels for 900 MHz radios are +/- 2.5 kHz on audio peaks, and 400 Hz for PL tones. These values will be doubled for lower frequency radios. Look up the value you observed on the graph's Y-axis and read the deviation on its X-axis.
The scope will indicate peak-to-peak value. Deviation is normally measured and reported as a peak value, so you need to look up half the value the scope shows. For example, if you get 1 volt peak-to-peak, you actually have 0.5 volts peak, 0.3535 Vac, which is -6.8dBm, and that's equivalent to a deviation of roughly 3.1 kHz on my MaxTrac. How did I figure all this out? Remember that equation I told you to keep in mind earlier? Well, we can plug the numbers into it directly:
-6.8dBm = 20 * log ( 0.3535 / 0.775 )
Remember at the beginning of the article I mentioned the 0.350 Vac level the MaxTrac manual says should be present with a 1 kHz tone modulated at 3 kHz deviation. Well, this calculates out to -6.90dBm, which is darn close to the value I measured as shown in the table above. I can deal with an error of around 3% any day of the week, especially when you consider the manufacturing tolerances of these radios.
Here's some CW from a local 900 MHz repeater - the Morse code pattern for a slash between the call sign and the letter R can be seen on the left. This trace is from my GTX radio. The scope says 0.48 Vp-p but there are a few noise spikes that pushed it that high; the majority of the signal is 0.4 Vp-p, or 0.2 Vpeak, which is equal to a level of 0.1414 Vac. This converts to -14.78dBm, and on my calibration curve this is about 920 Hz. CW identification level is typically 30 - 40 percent of the maximum deviation - on 900 MHz this works out to 750 - 1000 Hz.
If the repeater is not currently on the air but it has transmit PL, key the repeater - don't forget to identify - and look at the PL deviation. If the repeater identifier interferes with the reading, wait until it finishes and repeat the process. Here's what one local repeater's 192.8 Hz PL signal looks like (by the way, this is a 900 MHz Nucleus 2 transmitter being fed audio and PL from a MaxTrac). Since this is a sinusoidal signal, the scope's 60mVrms reading can be used directly. Converting this to dBm using (20 * log (60 / 775)) we get -22.22dBm. Looking this up on my GTX table, we get a deviation of 400 Hz, which is exactly what the service monitor indicated when it was first set up:
Here's another local repeater that's using a MaxTrac 900 MHz radio as a transmitter. The scope shows 58mVrms and the PL is 100 Hz. This gets converted to -22.52dBm, and my GTX table says this is equivalent to a deviation of about 370 Hz.
PL levels on 900 MHz are lower that other bands, typically 350-425 Hz, so both of these repeater systems are right on the money.
Other Uses:
If you're setting up your own equipment, feed a sine wave audio tone into the repeater's input and adjust the transmitter deviation while observing the scope or meter. Do this using 400 Hz so the transmitter's pre-emphasis circuit doesn't affect the signal. As long as the modulation signal is sinusoidal or relatively constant (someone whistling or loudly saying a long drawn out "aaaaaaaaah", or "four" (i.e. "fouuuuuuuuuur"), you can use Vac or Vrms, but for peaky, voice signals, you would be better using an oscilloscope and reading peak-to-peak voltages. You can now set the repeater deviation and audio gain. PL deviation and even the repeater's identifier level can also be set this way.
If there's someone doing work at the repeater and they can't measure deviation there, you can hook your scope or meter to your receiver and have the other person send in a tone or even whistle into a microphone. You can then relay the deviation back to the person at the repeater.
Note from WA6ILQ:
Some repeater controllers can be used to send test tones, look under "Paging Tones" in
the manuals index. Or if yours doesn't, simply stretch the courtesy beep to the maximum
length, maybe 10 or 15 seconds and kerchunk the repeater. Some have the ability to change
the level (amplitude) as well as the frequency. Eight different commands could be used to
define (perhaps in macros) 400 Hz, 1,000 Hz, 2,000 Hz and 3,000 Hz at 3 kHz deviation,
and a second set at perhaps 4 kHz deviation.
It would also be useful to have a receiver with a calibrated deviation chart up at the repeater all the time. You can then feed a signal into a radio on the repeater's input, look at the input signal with your monitoring radio, note the deviation, then switch to the repeater's output signal, and adjust accordingly. A two-channel MaxTrac works great in this application. Some repeaters operate with equal input and output levels, others provide some audio gain to deal with users with low deviation or poor microphone technique, others have fancy broadcast-quality audio leveling equipment.
You could make your own indicating instrument by taking a DC meter and driving it with a rectifier circuit (tapped in before the volume control). If calibrated properly, it can directly indicate the deviation in kHz. Note that when used with radios with different audio output levels, like the Maxtrac and GTX shown above, it may need multiple calibrations scales.
I think you can see the usefulness of having a calibrated and inexpensive means of measuring deviation with only 15 minutes work.
Acknowledgements and Credits:
Contact:
The author can be reached at: his-callsign [ at ] comcast [ dot ] net.
This page last updated 01-Apr-2012.
Back to the top of the page
Up one level
Back to Home
Article © Copyright 2005 By Robert W. Meister WA1MIK
Artistic layout and hand-coded HTML © Copyright 2005 and date of last update
by Mike Morris WA6ILQ
This web site, and the information presented in and on its pages is © Copyrighted 1995 and (date of last update) by Kevin Custer W3KKC and multiple originating authors.